Unaccounted Income of India: A methodological development
SACCHIDANANDA MUKHERJEE, Professor, National Institute of Public Finance and Policy, New Delhi, India. email:sacchidananda.mukherjee@nipfp.org.in
R. KAVITA RAO, Director, National Institute of Public Finance and Policy, New Delhi, India. email:director@nipfp.org.in
|
There has been a lot of interest in understanding and measuring the size of unaccounted incomes in India. Unaccounted income can be classified into two broad groups - a) undisclosed income or black money - incomes which should have been reported to tax authorities but were not, and b) extent of under-reporting of national income (or Gross Domestic Product, GDP) and output, because of non-reporting (or under-reporting) of incomes and output (Acharya, 1983). While these two groups may overlap, they do not coincide. The established methodologies to estimate unaccounted income can be classified into three broad categories:
1. The monetary method (or currency demand approach) 2. The latent variable method and 3. The global indicator method.
In a recent paper, we develop a new methodology for estimation of unaccounted income using road freight transport as universal input (Mukherjee and Rao, 2015). The strong relationship between transportation output and economic growth has been established in literature (Lahiri et al., 2003). Lahiri and Yao (2006) shows that transportation sector plays an important role in propagation of business cycle of US economy. The study finds one-to-one correspondence between cycles in the transportation sector and those in the aggregate economy. Often transportation sector output index is used to forecast economic growth cycles (Lahiri et al., 2003).
First, we estimate annual demand for road freight transport based on Input-Output (I-O) table and other macro variables available in National Account Statistics.
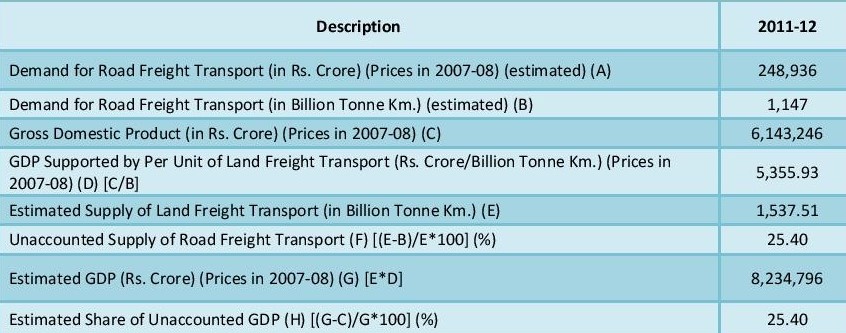
Second, we estimate annual supply of road freight transport based on availability of diesel for road freight transport, stock of goods carriages, average freight transport capacity per vehicle, average annual distance travelled and average fuel efficiency per vehicle. In an ideal situation, supply of road freight transport should match the demand for a given period (say annual). If supply exceeds demand, it suggests a possibility of under reporting in GDP. Given that there are no well-established sources of information on variables such as average freight transport capacity per vehicle, average distance travelled and average fuel efficiency per vehicle, the paper constructs these values from information available from various sources. Based on this broad framework, the study estimates unaccounted GDP for India.
Table 1: Estimation of Unaccounted GDP for India (based on I-O table 2007-08): 2011-12
Source: Mukherjee and Rao (2015)
To check the robustness of the estimates, the analysis is carried out with two consecutive I-O tables (2003-04 and 2007-08) and for three consecutive years (2009-10 to 2011-12) to rule out the possibility of these estimates being a random occurrence. Table 2 shows that over the years percentage share of unaccounted GDP is decreasing. Similarly, while the estimates using the two alternative I-O tables are somewhat different, the differences are not large. The differences observed can |
be attributed to structural changes of Indian economy (as reflected through I-O table).[1]
Table 2: Estimation of Unaccounted GDP in India
Source: Mukherjee and Rao (2015)
Carrying out a comparative static analysis to check the sensitivity of estimates
The results show that 10 percent increase in average daily distance covered by goods carriages will increase the estimated unaccounted GDP by 9.26 percent. The observed increase in unaccounted incomes can be attributed to changes in the composition of vehicles in favour of medium and heavy commercial vehicles which are fuel efficient in terms of payload transport (carrying capacity weighted distance travelled per litre of diesel), as a result supply of transport services increases. Similarly, 10 percent fall in average fuel efficiency will lead to 22.47 percent fall in estimated unaccounted GDP. 10 percent increase in average carrying capacity will result in 26.65 percent increase in estimated unaccounted GDP. In other words, if one incorporates any estimate of overloading of vehicles, the estimates of unaccounted incomes would increase. In addition, 5 and 10 percent additional availability of diesel will increase unaccounted GDP by 27.5 and 50.7 percent respectively for 2011-12.[2]
Conclusion
The results show that for reasonable assumptions, fairly consistent estimates of unaccounted GDP can be derived. The actual level of unaccounted GDP in the country can be calibrated by incorporating estimates of adulteration in diesel and estimates of overloading in trucks.
References
Acharya, Shankar 1983. "Unaccounted Economy in India: A Critical Review of Some Recent Estimates", Economic and Political Weekly, 18(49): 2057-59+2062-68.
Lahiri, K., H. Stekler, W. Yao and P. Young, 2003. "Monthly Output Index for the U.S. Transportation Sector", Journal of Transportation and Statistics, 6(2-3): 1-27.
---------------and V.W. Yao, 2006. "Economic indicators for the US transportation sector", Transportation Research Part A, 40(10): 872-887.
[1] According to 2007-08 I-O table, among all the modes of transport (railway, land, water and air), the share of land transport in total demand for input transport services was the highest (82%). According to 2003-04 I-O table, it was 76 percent.
[2] It is often argued that diesel is adulterated, primarily with kerosene. It is therefore, interesting to ask what effect an increased effective supply of diesel has on estimates of unaccounted demand for road freight transport and corresponding unaccounted GDP.
|


